Analyzing graphs and networks
A while back, my labmate Ju showed me a visualization he was working on to explore co-authorships at FredHutch, which inspired me to use REntrez to visualize my much more modest publication network. I wrote a small snippet of code that showed the different research circles I participated in over the years. Before this, I also did some analyses on gene networks (see below).
Getting network data
There are many public sources of network data, notably Stanford Large Network Dataset Collection, UCIrvine Network Data Repository, KONECT and academic groups like Uri Alon and Mark Newman. Biological data can be obtained from KEGG or STRING.
Generating your own networks
Rather than obtaining data on existing networks, networks can also be generated de novo using preset rules. You can generate nodes with random attributes and place them using Sobol sequences, ensuring that the points are randomly but also evenly placed.
Network properties
Most networks have basic properties like assortativity/homophily and clustering coefficient. Nodes also have degree and centrality, which can be measured in several ways. Graphs, especially multigraphs can pose interesting traversal problems, like Hamiltonian or Eulerian path. For statistical modeling, the Exponential Random Graph Model ERGM and Barabasi-Albert are useful conceptualizations of networks.
Depending on its type of data, a network can also have additional properties brought on by the metadata of the nodes and edges, which you can query and model on.
Working with networks
First, you have to get your data into a format amenable to network analysis. The simplest is a table containing nodes and edges, which most software can parse. If you have a lot of network data, you may want to use a graph database like Neo4J. To make graph data easier to manipulate, you may want to consider tidygraph, which uses syntax inspired by the tidyverse. Depending on how big your dataset is, you may want to create a subgraph, work on it before applying changes to the entire network. You can also choose to work with the edge and/or node attributes in tabular format before applying them to the network.
For programmatic access, the cross-platform igraph library is fairly well-known and has its own data structure. If you’re working in R there is intergraph to interconvert between igraph, network and basic data.frames containing nodes and edges.
Graph traversal problems, which can also serve as abstractions of combinatorics (eg. multiple comparisons), can be solved using the PairViz package.
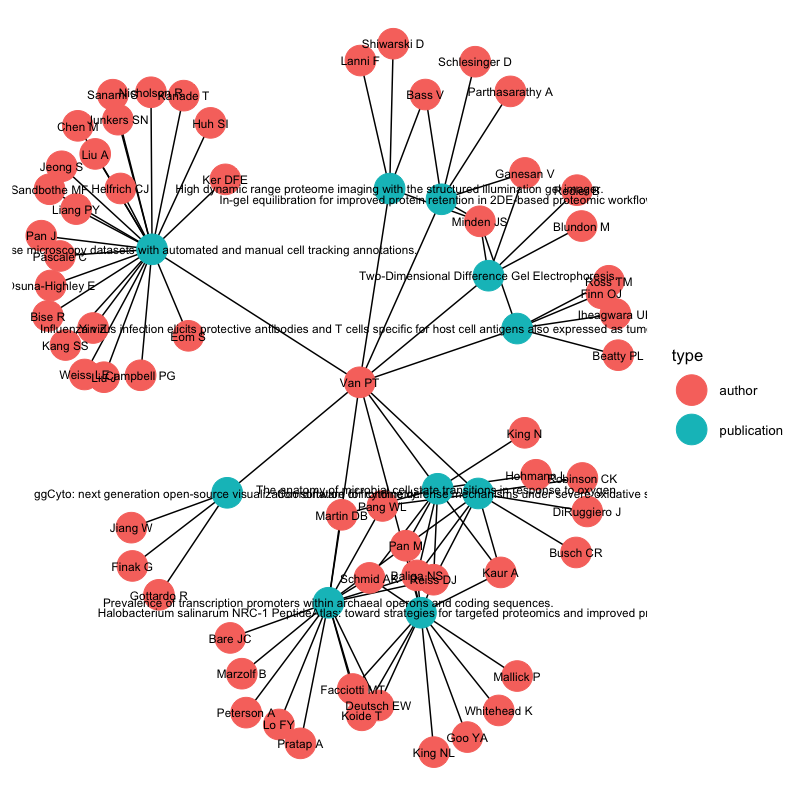
While igraph has plotting capabilities, I personally find its plots unattractive. Instead I used ggnetwork and ggraph, which uses Grammar of Graphics syntax (made famous by the now standard ggplot2), producing this image for my co-authorship network:

Biological data can also benefit from network analysis, like genes that show co-expression or proteins that share structural similarity. Due to the availability of annotation data from sources like STRING, it’s fairly straight-forward to query and analyze gene networks. More complex techniques like network propagation could also be used.
That’s good enough for my purposes. But if you need interactivity, visNetwork is likely what you want. A collection of R network analysis packages is maintained and documented at statnet.
For Python, NetworkX is fairly mature package. For quick interactive explorations, you can also use gephi and/or Cytoscape.
Dynamic networks
More interesting but complex are networks whose nodes, edges or attributes change over time. These can be relatively simple, like the classic social network Marriage and Elite Structure in Renaissance Florence, 1282-1500, to the more complex network of healthy and infected people during the 2019-2020 coronavirus pandemic. These coronavirus networks are varied, ranging from classic SIR models to much more sophisticated models, some are modelled and visualized using networks. One of the more informative explanations of epidemic simulations I have found is this demonstration from Grant Sanderson.
I should note that while the tools are readily available, eg. from the Institute for Disease Modeling, epidemiologic models require considerable expertise to properly parameterize and interpret, so they are prone to misuse by novices.
References
A fairly academic introduction to networks can be found in the book Social and Economic Networks. A more practical book is Complex Network Analysis in Python. The previously-mentioned statnet maintains a collection of tutorials on their Github page that includes both theory and R-specific examples.